|
Purpose
SpotFinderF if a simplified version of
SpotFinderZ designed to work in the absence of cell data. This function
provides only partial functionality and is included on experimantal basis. The
purpose of this tool is detecting spots with subpixel resolution on images
without cells.
SpotFinderF uses most of the
parameters of SpotFinderZ, which have the same meaning. There is, however,
no training tool. The training can be performed with SpotFinderZ or done
manually. The most sensitive parameter is "Min. height", which has to be reduced
to detect more spots. The acceptable level can be obtained by displaying the
results after processing.
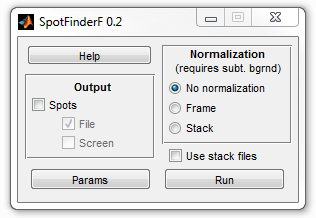
The program can normalize the data by dividing the intensity by the average
intensity in the current frame (if "Frame" normalization is selected) or in the
whole set of frames (if "Stack" normalization is selected). The output can be
performed either to a file (if "File" is selected) or to MATLAB's workspace (if
"Screen" is selected).
Output format
The output variable is called spotList and is a
hierarchical MATLAB's cell array. It is an array of frames, each being an
array of spots, each being a structure of fields describing one spot in one
frame. Each such structure has the format similar to
the output format of SpotFinderZ.
Namely, the structure has the following fields:
-
x - euclidian coordinate from the left of the image.
-
y - euclidian coordinate from the top of the image.
-
m - magnitude (brightness) of the spots (combined brightness under
the Gaussian fit excluding background).
-
h - height of the spots (one of the Gaussian fit parameters).
-
w - width of the spots (one of the Gaussian fit parameters).
-
b - background under the spots (one of the Gaussian fit parameters).
Displaying results
To visualize the results, use the dispcellall function:
images = loadimageseries('your_folder_with_images');
dispcellall(images,spotList)
Replace your_folder_with_images with the folder
name where the images are and replace the number 1 in the second line to the
number of the frame you would like to display.
Outputting data to Excell
To save the results in Excel format, use the
exportspots2xls function:
savespots2xls(spotList)
The program will ask you for the output file name. The data is saved as a
table with eight columns: the frame number, the spot number and the six
characteristics of the spots (the same and in the same order as above).
Example
This example demonstrates how to perform the analysis and display the data
using an image of individual Cy5 fluorophores immobilized on a glass coverslip
(courtesy of Dr. Sangjin Kim).
1. Start MATLAB. Set the working path in MATLAB to the folder of the
example: ...\MicrobeTracker...\examples\spotfinder2
(see the image below, click on the image for its full resolution version).

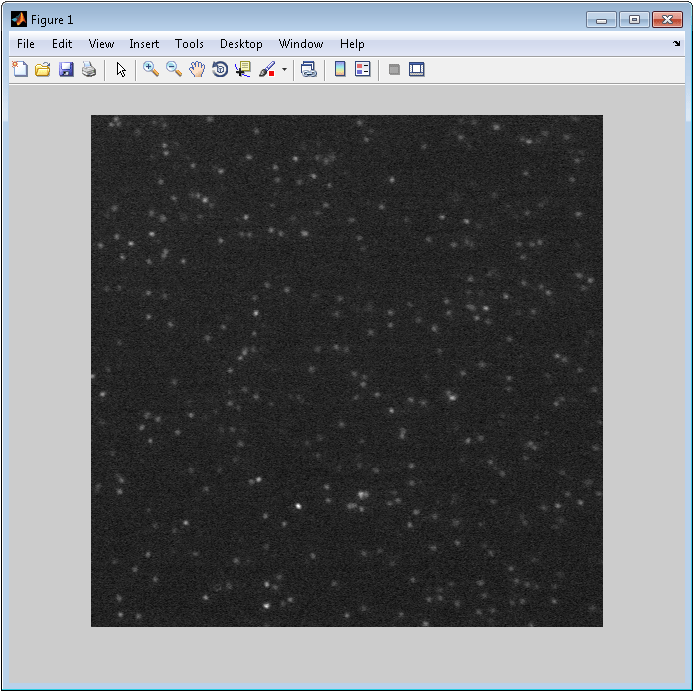
1a. This step is optional. It you want to see the raw data, load the images
into the workspace. Type in MATLAB's command window:
images = loadimageseries('spotfinderf');
and use MATLAB's
imshow
command (for the first image in the stack if the file is a multipage TIFF):
imshow(images(:,:,1),[])

2. To start SpotFinderF, type in MATLAB's command window:
spotFinderF

3. Select Spots checkbox on the Output panel. Screen
checkbox gets automatically selected, which means that the data will appear in
MATLAB's workspace. Click on Params and then Load to load the
parameters from spotfinderf.sfp file. Click
OK to close the parameters window.
4. Press Run to start SpotFinderF. Select
spotfinderf folder for the images. Because you are
not outputting data to a file, no file is requested. Now the program will
display a progress bar and perform processing for about a minute. When it is
done, spotList variable will appear in the
workspace.
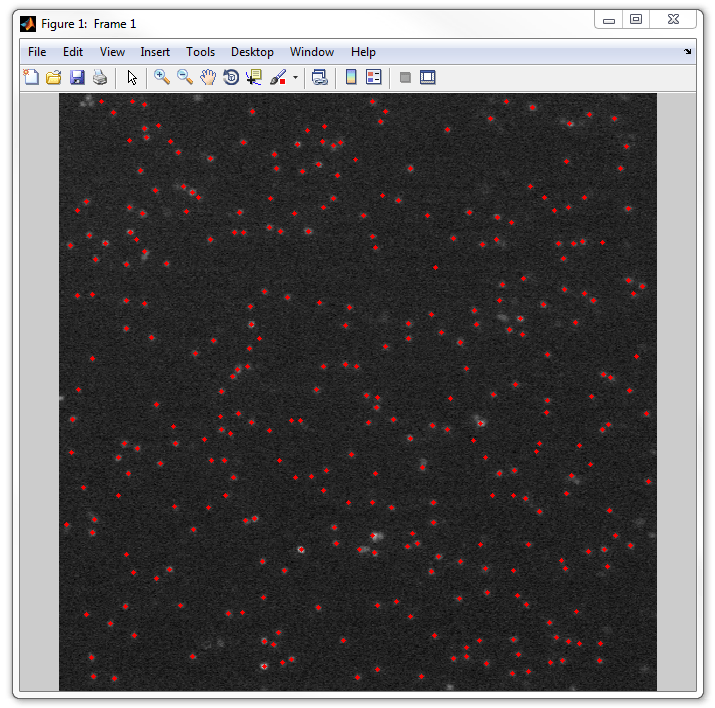
5. Now let's display the images with the detected spots. If you skip the 1a
step and the images have not been loaded, load them now:
images = loadimageseries('spotfinderf');
Now run dispcellall tool:
dispcellall(images,spotList)

6. It also possible use various display options of the dispcellall tool,
for example to display the spots as yellow circles:
dispcellall(spotList,images,1,[],[],[],4,[1 1 0],'circle')

For an example of testing the Shift limit parameter using the same
data set, see the example for
testspotprecision function.
|