|
Syntax:
meaninthist(cellList)
meaninthist(cellList1,cellList2,...)
meaninthist(cellList1,cellList2,signal1,signal2,...)
meaninthist(cellList,xarray)
meaninthist(cellList1,cellList2,xarray)
meaninthist(cellList1,normfactor)
meaninthist(cellList1,normfactor1,cellList2,normfactor2)
meaninthist(cellList1,cellList2,'overlap')
meaninthist(...'nooutput')
meaninthist(...'nodisp')
intlist = meaninthist(cellList)
[intlist1,intlist2] = meaninthist(cellList1,cellList2)
This function plots a histogram of the mean intensity
inside every cell
in a population, i.e. total intensity divided by the area of the
cell. Note, the background has to be subtracted before detecting the signal in
MicrobeTracker.
-
<cellList> is an array that contains the meshes. You can
drag and drop the file with the data into MATLAB workspace or open it using
MATLAB Import Tool. The default name of the variable is cellList, but
it can be renamed.
-
<cellList1>, <cellList2> ˗ you can load two or more
arrays, they will be plotted together for comparison.
-
<signal1>, <signal2> - the signal field which will be
processed. Must be in single quotes and must start from the word 'signal'. The
default is 'signal1'.
-
<xarray> ˗ array of x values for the histogram, which serve the
centers of bins of the histogram (the boundaries will be in between, for
example [1 2 3 4 5] to display all the cells with intensities less than 1.5 in
the first bin, between 1.5 and 2.5 in the second, etc.).
-
<normfactor>, <normfactor1>, <normfactor2> ˗
conversion factors from image units. Use only if normalization is known.
-
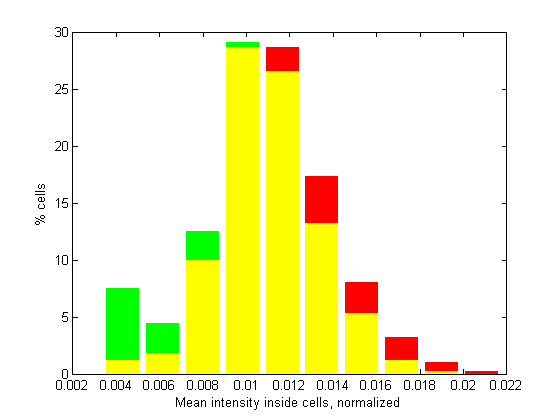
'overlap' ˗ indicate this if you wish the histograms to overlap,
otherwise they will be displayed separately. The default colors for
overlapping bars are red (first set), green (second set), and yellow
(overlap).
-
<intlist>, <intlist1>, <intlist2> ˗ arrays
containing the length of every cell to save and plot separately.
-
<nooutput> blocks standard text output (type of data processed, mean,
and standard deviation; only a figure is displayed).
-
<nooutput> blocks figure output (only text output is produced).
Example
>>% First load the data from two files and assign it to two different variables
(here c1 and c2)
>>load('c:\test\example1.mat')
>>c1 = cellList;
>>load('c:\test\example2.mat')
>>c2 = cellList;
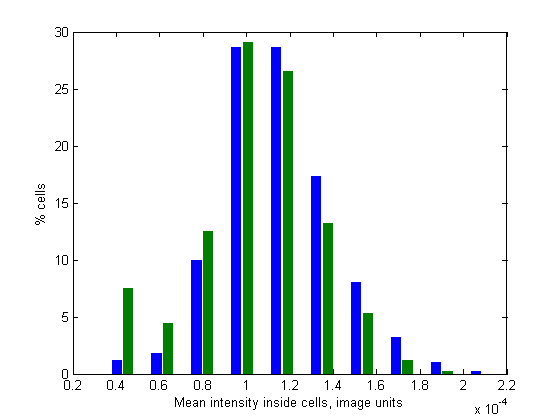
>>% Now plot a histogram
>>meaninthist(c1,c2)

Mean intensity inside cells, image units
Processed 2 datasets
Set 1: mean 0.00011441, std 2.5648e-005
Set 1: mean 0.00010174, std 3.2709e-005
>>% Now plot an overlapping-style histogram also
using a scaling factor 100
>>meaninthist(c1,c2,100,'overlap')

Mean intensity inside cells, normalized
Processed 2 datasets
Set 1: mean 0.011441, std 0.0025648
Set 1: mean 0.010174, std 0.0032709
|